A very Good Business Process Definition - A business process is a flow of decision-coordinated activities, conducted by participants and acting on data, information and knowledge то reach a goal.
Business Rules Approach, the four C's:
o Classify - classify the type of employee or customer or contract, the type of entity that we are dealing with, to narrow down where that rule applies to.
o Compute - for example how many purchases or orders we have for the past three months, it could be a database look up or a data that is provided within in the process
o Compare - compare all data with predefined lines. To put in action the rule.
o Control - whether or not the discount apply to the customer or particular fact are true and hence that control back to the business process.
"The Old Seven."
"The First Seven."
"The Basic Seven."
Quality pros have many names for these seven basic tools of quality, first emphasized by Kaoru Ishikawa, a professor of engineering at Tokyo University and the father of “quality circles.”
1. Cause-and-effect diagram (also called Ishikawa or fishbone chart): Identifies many possible causes for an effect or problem and sorts ideas into useful categories.
2. Check sheet: A structured, prepared form for collecting and analyzing data; a generic tool that can be adapted for a wide variety of purposes.
3. Control charts: Graphs used to study how a process changes over time.
4. Histogram: The most commonly used graph for showing frequency distributions, or how often each different value in a set of data occurs.
5. Pareto chart: Shows on a bar graph which factors are more significant.
6. Scatter diagram: Graphs pairs of numerical data, one variable on each axis, to look for a relationship.
7. Stratification: A technique that separates data gathered from a variety of sources so that patterns can be seen (some lists replace "stratification" with "flowchart" or "run chart").
Excerpted from Nancy R. Tague’s The Quality Toolbox, Second Edition, ASQ Quality Press, 2004, page 15.

How?
Merits?
Demerits?

Ishikawa diagrams (also called fishbone diagrams or cause-and-effect diagrams) are diagrams that show the causes of a certain event.
A common use of the Ishikawa diagram is in product design, to identify potential factors causing an overall effect.
For more info see here
The role of the BA facilitator is to guide activities on developing both the vision and software solution. The key word here is guide.
The BA facilitator role provides process to group settings and avoids participating in content. Typically, the BA facilitator role serves as the liaison between stakeholders, and the stakeholders and software development team respectively. As the liaison, the BA facilitator role uses various techniques and emotional intelligence skills to assist project sponsors and/or team leaders in accomplishing group meeting goals:
• Facilitation Techniques for identifying solution features
o Creating a Solution Vision and Scope
- Brainstorming – discussing of ideas
- Brainwriting – submitting written ideas for discussion
- Focus Group Meetings – soliciting opinions
- Joint Application Design – resolving conflicts
- Root Cause – 5 whys, Ishikawa Diagrams
- Force-Field – listing negative and positive influences
- As-Is and To-Be Gap
- Multi-voting – subjective paring down a long feature list
- Criteria-Based Grid – weighting feature value criteria
- Impact/Effort Grid – comparing feature benefits versus effort
• Emotional Intelligence Skills for interfacing with stakeholders
o Active Listening and Paraphrasing
o Generating Participation
o Neutrality – focus on meeting process instead of solution content
o Questioning – seeking answers rather than posing solutions
o Maintaining Focus – use a parking lot and issue log for off agenda topics
o Obtaining Stakeholder Feedback
o Summarizing and Synthesizing Ideas
o Conflict Intervention
From The Need for the Business Analyst Facilitator Role
in an Agile Software Development Team
By Mark Monteleone, CBAP
This scheme provides information for the desired skills from recruiters about the role
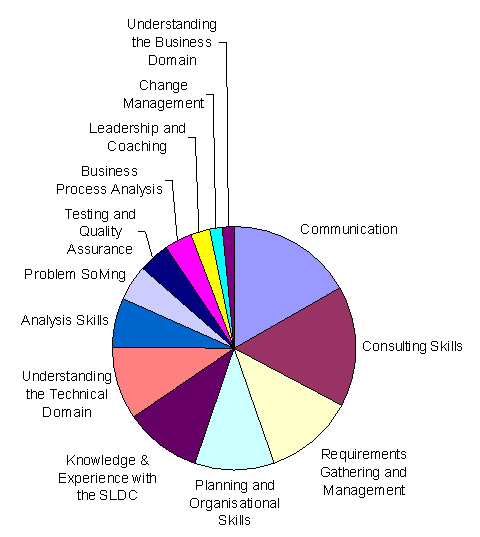
The requirements gathering is a major part of the Business Analyst responsibilities.
As a first step of every project the requirements are crucial for the next phases of the project. They have to be complete and useful.
Here is a list of the characteristics of the requirements
- Cohesive - The requirement addresses one and only one thing.
- Complete - The requirement is fully stated in one place with no missing information.
- Consistent - The requirement does not contradict any other requirement and is fully consistent with all authoritative external documentation.
- Correct - The requirement meets all or part of a business need as authoritatively stated by stakeholders.
- Current - The requirement has not been made obsolete by the passage of time.
- Externally Observable - The requirement specifies a characteristic of the product that is externally observable or experienced by the user. "Requirements" that specify internal architecture, design, implementation, or testing decisions are properly constraints, and should be clearly articulated in the Constraints section of the Requirements document.
- Feasible - The requirement can be implemented within the constraints of the project.
- Unambiguous - The requirement is concisely stated without recourse to technical jargon, acronyms (unless defined elsewhere in the Requirements document), or other esoteric verbiage. It expresses objective facts, not subjective opinions. It is subject to one and only one interpretation. Vague subjects, adjectives, prepositions, verbs and subjective phrases are avoided. Negative statements and compound statements are prohibited.
- Mandatory - The requirement represents a stakeholder-defined characteristic the absence of which will result in a deficiency that cannot be ameliorated.
- Verifiable - The implementation of the requirement can be determined through one of four possible methods: inspection, analysis, demonstration, or test. The expected methods are usually test or demonstration. The inspection or analysis are done just in special cases.
For more information see here